
Google Analytics have announced a new landing page report in GA4. This well used report in UA (legacy) Google Analytics will be well received by digital marketing professionals that have used GA for years.
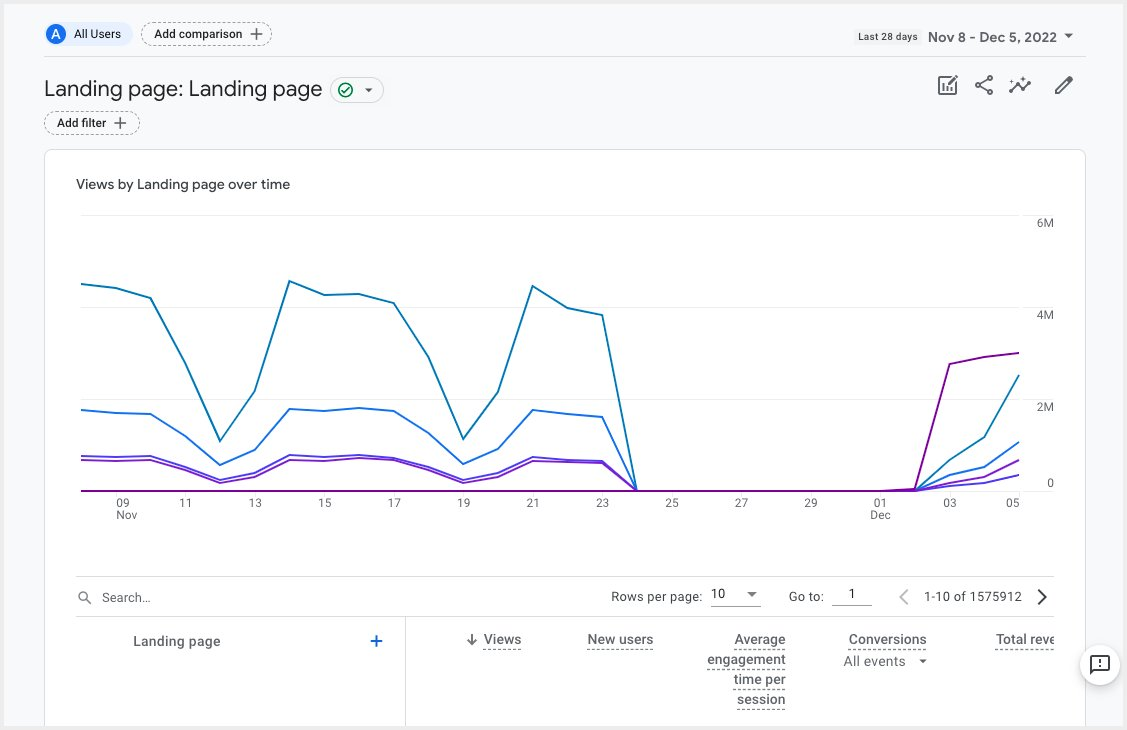
You can navigate to the report via ‘Reports’ > ‘Engagement’ > ‘Landing page’ and it’s possible to then cross filter the data with ‘dimensions’. The line graph shows the top 5 pages by ‘views’ as a default and as on other regions in GA4 you can toggle by page to refine / compare from this point.
How does the GA4 landing pages report compare to the existing (legacy) UA Google Analytics landing page report?
Within UA Google Analytics, we are presented with the following data beneath the line graph in the tabular view:
- Landing page
- Sessions
- % New Sessions
- New Users
- Bounce Rate
- Pages / Session
- Avg. Session Duration
- Transactions
- Revenue
- Ecommerce Conversion Rate
Contrastingly, GA4 provides us with:
- Landing page
- Views
- New users
- Average engagement time per session
- Conversions (All events)
- Total revenue
The key differences here are the removal of ‘bounce rate’ and ‘conversion rate’ – plenty has been written about the inaccuracies/uselessness of ‘bounce rate’ but conversion rate would be a nice addition to this new GA4 report.
Daily users of Google Analytics will definitely welcome this report; it is a decent step towards a smoother transition from UA Google Analytics to GA4.
Duncan Colman